
Adherence to the planetary health diet index and metabolic syndrome: cross-sectional
Study design and population
This cross-sectional study used data from the PERSIAN cohort study (Prospective Epidemiological Research Studies in Iran). The main objective of this prospective study was to investigate and improve the health outcomes of the staff of Mashhad University of Medical Sciences. The PERSIAN Cohort will serve as a vital infrastructure for future implementation research, providing essential evidence to inform new healthcare policies aimed at improving the control, management, and prevention of non-communicable diseases (NCDs). The cohort was composed of 10,000 adults from 2017 to 2020 in Mashhad, Iran.
For the present study, data from 5206 participants (44.7% men) were included. The inclusion criteria were meeting the age criteria (30 – 70 years). They needed to be residents of Mashhad and hold Iranian citizenship. Participants with a daily energy intake of less than 800 kcal or more than 4200 kcal were not eligible to participate. Incomplete measurements of the subjects led to their exclusion from the study.
Sociodemographic and lifestyle characteristics and medical history were collected through interviews. Anthropometric measurements were performed by trained personnel. Written informed consent was obtained from all participants. More information about the PERSIAN cohort study is available elsewhere [13]. This study was approved by the Ethics Committee of the Mashhad University of Medical Sciences (Code of Ethics: IR.MUMS.MEDICAL.REC.1401.231). The study process is presented in Fig. 1.
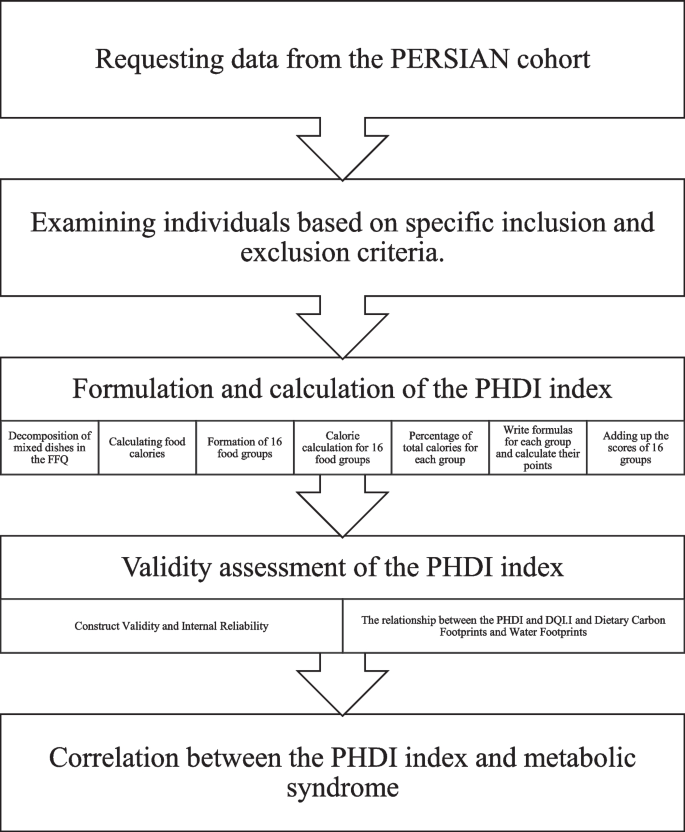
The study flowchart. The flowchart shows the process of the study; PHDI Planetary Health Diet Index, FFQ food frequency questionnaire, DQI-I Diet Quality Index-International
Measurements
All measurements were obtained from the PERSIAN cohort study.
Metabolic syndrome
MS was characterized as the presence of any three of five following criteria [18]: (1) WC ≥ 95 cm [19]; (2) FBG ≥ 100 mg/dl or drug therapy; (3) fasting TGs ≥ 150 mg/dl or drug therapy; (4) fasting HDL-c
Anthropometric parameters and blood pressure
Weight was measured with a calibrated electronic scale (InBody 770, Cerritos, CA, USA) with minimum clothing. Participants were measured while wearing minimum clothing and without shoes. Height was measured using a stadiometer with an accuracy of 0.1 cm without shoes. Body mass index (BMI) was calculated by dividing body weight (kilograms) by height in meters squared. WC was measured with the participants in a standing position with flexible tape with an accuracy of 0.1 cm.
Blood pressure was measured by a trained nurse using a standard sphygmomanometer in a quiet room after 5–10 min of rest.
Biochemical assessments
All blood samples were collected after a 10–12-h overnight fast in potassium-EDTA vacuum tubes. FBG, total cholesterol, TG, HDL-c, and low-density lipoprotein cholesterol (LDL-c) were measured using standard laboratory procedures and analyzed using a standard analyzer.
Dietary assessment
A validated 130-item food frequency questionnaire (FFQ) was used to assess dietary intake [20]. Participants were asked to indicate how frequently they had consumed each food or drink in the past year. The frequency of intake for each item was reported as how many times a day, week, or month. The intake of energy, macronutrients, and micronutrients was measured by multiplying the frequency of each unit of food item by the energy and nutrient content of the determined portion size. An adopted version of Nutritionist IV software for Iranian foods (version 7.0; N-Squared Computing, Salem, OR, USA) was used in order to assess the nutrient and energy intakes [21]. To calculate the caloric intake of specific food groups for the calculation of the PHDI, all mixed dishes in the FFQ were decomposed into separate ingredients. There were only two mixed dishes in the FFQ questionnaire: Sholleh Mashhadi and pizza. We used the common recipes to calculate their ingredients.
Development of the PHDI
The PHDI is based on the “Planetary Health Diet” recommendations; this diet is set with energy intake (2500 Cal/day), with 23 different food groups [12]. To tailor these recommendations to accommodate various caloric needs, the ranges and midpoints suggested for each food group were calculated based on their energy contribution to a reference diet of 2500 kcal per day. The components, cutoffs and thresholds of the PHDI were defined based on these values, as described in Table 1.
The index includes sixteen components, with categories in four groups: (1) adequacy components; (2) optimum components; (3) ratio components; and (4) moderation components. Each component is scored between 0 and 5 or 10 points. Food groups classified as adequacy components were those where a zero intake (i.e., non-consumption) would be associated with lower dietary quality, whereas intakes at or above the reference levels would likely pose minimal risks to both human and planetary health. As a result, nuts, legumes, fruits, total vegetables, and whole grains were identified as adequacy components. Similarly, optimum components were chosen based on food groups where a certain minimum intake (represented by midpoint values) is preferable to non-consumption. However, as consumption nears or surpasses an upper limit—based on the maximum values set by the reference diet—it could negatively impact both sustainability and diet quality. Eggs, fish, seafood, potatoes, dairy, and unsaturated oils were categorized as optimum components.
In the PHDI, two ratio components reflect the proportion of dark green vegetables and red and orange vegetables relative to total vegetable intake. To prevent overemphasizing this dietary aspect, a maximum score of 5 points was assigned to each ratio component. Unlike adequacy components, moderation components were selected based on the assumption that lower intakes (approaching zero) would lead to higher diet quality and sustainability. Red meat, poultry and substitutes, animal fats, and added sugars were identified as moderation components in the PHDI. Detailed information about the PHDI and its scoring is found in the study by Cacau LT. et al. [13].
Assessment of demographic variables
Sociodemographic and lifestyle data were assessed using validated questionnaires as used for the PERSIAN cohort study.
Physical activity (PA) was measured by a validated 28-item Physical Activity Questionnaire designed by the PERSIAN Cohort. Physical activity level was evaluated based on self-reports of weekly activities using Metabolic Equivalent Rates (METs) of participants [22]. The MET of each activity was extracted using a compendium of physical activities.
Validity assessment
PHDI performance was assessed using a strategy to evaluate construct validity and reliability, as described by Reedy et al. [23], Additionally, we examined the relationships between the PHDI and overall dietary quality [24] and between the PHDI and carbon and water footprint estimations to assess the validity of the PHDI. To evaluate construct validity, linear regression was used to assess the relationships between total PHDI scores and selected nutrients.
In the third step, we used principal component analysis (PCA) to evaluate whether PHDI had more than one factor that explained the data variability. In this analysis, the correlation matrix was calculated using varimax rotation, and eigenvalues greater than one were only used to define the number of factors [25]. As an auxiliary method, we used the scree test to determine the degree of variation of each main component [26].
To evaluate internal reliability, Cronbach’s alpha was calculated to measure the mean of the correlations between all possible combinations of the PHDI components [27]. Linear regression was used to examine the association of the PHDI score with overall dietary quality.
Overall dietary quality
We examined dietary quality by using the Diet Quality Index-International (DQI-I) [24]. The DQI-I includes four categories: 1) Variety: This category examines both overall variety and variety in different protein types to evaluate whether intake is obtained from different sources across and within food groups. 2) Adequacy: This item assesses the intake of nutrients that are critical for preventing malnutrition. 3) Moderation: This category evaluates food and nutrient intake related to chronic diseases. 4) Overall balance: This item evaluates the dietary balance in terms of the proportion of fatty acid composition and energy sources [24]. Detailed information about the DQI-I is explained in the study by Soowon Kim et al. [24].
Dietary carbon and water footprints
We used water and carbon footprints to consider the environmental aspects of diet. The carbon footprint is a measure of the total carbon dioxide produced by an activity or accumulated during the life cycle of a product [28]. The global database for carbon dioxide emissions of each food item from BCFNDOUBLEPYRAMIDDATABASE was used [29].
The water footprint is a measure of the total freshwater used for producing goods and services consumed by individuals or communities. The water footprint of each food must be multiplied by its amount to obtain the amount of water consumed for each food. The water footprint information was available for Iran [30, 31].
Statistical analysis
Categorical variables are described as numbers and percentages, and means ± SDs were calculated for continuous variables at baseline. Differences between quartiles of PHDI scores were examined with ANOVA and chi-square tests. Adjusted and unadjusted regression logistic models were used to evaluate the association of the PHDI with outcomes. Logistic regression models were adjusted for age and sex (Model 2) and more adjustments (education level, wealth score index, smoking status, sleep status, physical activity level, and energy intake) (Model 3).
The statistical analyses were performed using SPSS software version 26.0 (SPSS Inc., Chicago, IL, USA). P values